Sales Reports
Learning Outcome
On successful completion of this lesson, students will understand how to generate different sales reports.
Lesson
Sales Report Types
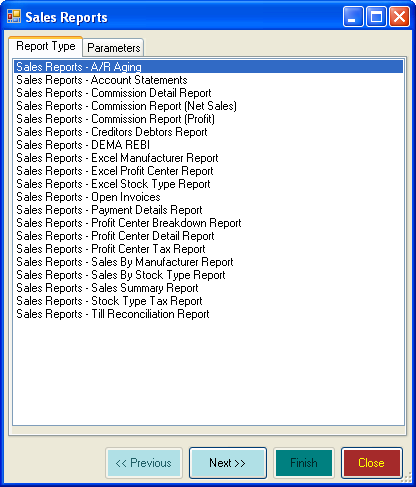
EVE contains the following Sales Reports Types:
A/R Aging
This report shows outstanding customer account receivable balances grouped into time periods of 30 days (by default). You can use it to see at a glance which customers have owed you money for an extended period of time.
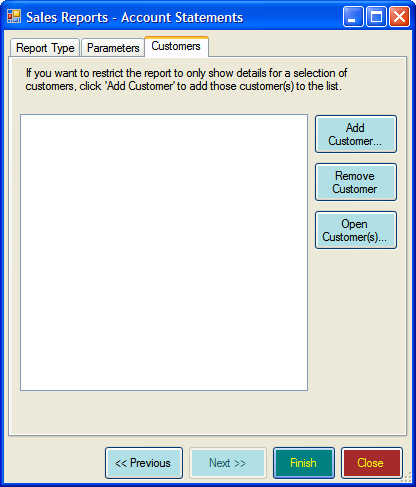
Account Statements
This report shows the account history for all open accounts that have had activity during the period you define. Details include purchases made, payments made, current amount due and payment due by date. You can send this to account holders, for example, at the end of every month. The report can be printed and sent through the post or emailed straight from EVE. With this report you will see an additional tab called Customers, which enables you to restrict the report to specific customers.
Commission Detail Report
This report shows details of invoices on which a selected employee has earned commission. Details listed are date/time, invoice number, customer, net sales and commissionable net sales.
Commission Report (Net Sales)
This lists all employees, the net sales each has been responsible for and the total commission due. Each employee and each stock item has a Commission Rate assigned to them. The Net Sales Commission figure is calculated by the following formula:
(Employee commission rate) x (Stock Item commission rate) x (Price at which the Stock Item was sold [including any discounts applied])
NOTE: Some customers are not ‘commissionable’. For example, if an employee sells himself a wet suit he is probably not due any commission on the sale.
Commission Report (Profit)
This report is similar to the one above. However, instead of showing net sales and the commission on those sales, it shows net profit and the commission due on the profit.
The Profit Commission figure is calculated by the following formula:
- (Employee commission rate) x (Stock Item commission rate) x (Net Profit).
Where Net Profit is calculated by the following formula:
- (Quantity sold) x [(Retail Price before tax) – (Cost Price before tax)]
Creditors Debtors Report
The parameters and period section are ignored for this report. It lists all people who owe, or are owed, money. Red lines shown indicate money owed by the customer; blue lines indicate money owed to the customer. The Credit column indicates the amount – positive values indicate money owed by the customer; negative values indicate money owed to the customer.
By default, both creditors and debtors are shown. Uncheck either of the check boxes at the bottom of the form to remove associated records from display. Details of individual accounts are shown. Therefore, if a customer has two accounts that both have a non-zero balance, two rows will be shown for that customer. Click ‘Open’ to view details of the selected Account.
Excel Manufacturer Report
Use this report to export sales data to Microsoft Excel for a fixed time period. In Microsoft Excel you will get one worksheet for each Manufacturer whose products were sold during the selected time period. There will be one row for each invoice line item. In addition, the first sheet will show a summary of the amounts on each subsequent worksheet.
Excel Profit Center Report
Similar to the above report except this time you will get one worksheet for each Profit Center with sales during the selected time period.
Excel Stock Type Report
Similar to the above report except this time you will get one worksheet for each Stock Type with sales during the selected time period.
Open Invoices
Use this report to show a list of invoices put on an in-store account that are still unpaid.
Payment Details Report
This lists all payments made in the selected time period, grouped by payment method. The following information is shown: Payment Method, Number (i.e. check number, credit card number, etc.), Invoice Number, Payment Type (always Regular Payment in this version of EVE) and Amount.
Profit Center Breakdown Report
This gives a summary of your sales in the selected time period, broken down by Profit Center. The report shows the net sales, tax, gross sales and COGS (Cost of Goods Sold) for each Profit Center.
Profit Center Detail Report
This report shows details of all items sold that fall within the profit center for the date range selected. Details shown are date, invoice number, stock type, stock item, COGS (Cost of Goods Sold), price, tax and total. You can run the report without first selecting a profit center, however this will generate a substantial amount of data.
Profit Center Tax Report
This report shows taxable and non-taxable sales and tax collected for each tax band by profit center for the time period you identify.
Sales By Manufacturer Report
This shows the net sales and COGS (Cost of Goods Sold) in a selected time period, grouped by Manufacturer
Sales By Stock Type Report
This shows the net sales and COGS in a selected time period, grouped by Stock Type
Sales Summary Report
Use this report to export sales data to Microsoft Excel for a fixed time period. The data will include one row in Microsoft Excel for each stock item on file, whether it was sold during the time period or not
Stock Type Tax Report
This report shows taxable and non-taxable sales and tax collected for each tax band by stock type for a selected time period.
Till Reconciliation Report
This gives a summary of the money taken in a selected time period, broken down by payment method. It shows payments and refunds.
Sales Report Parameters
You can customise many of the sales reports using the Parameters Tab.
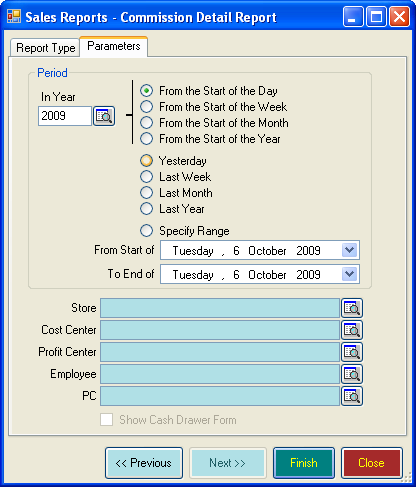
- Period – Choose a time period using one of the presets or specify a date range.
- You can further filter sales reports using the following fields:
- Store
- Cost Centre
- Profit Centre
- Employee
- PC